Total Installations Chart
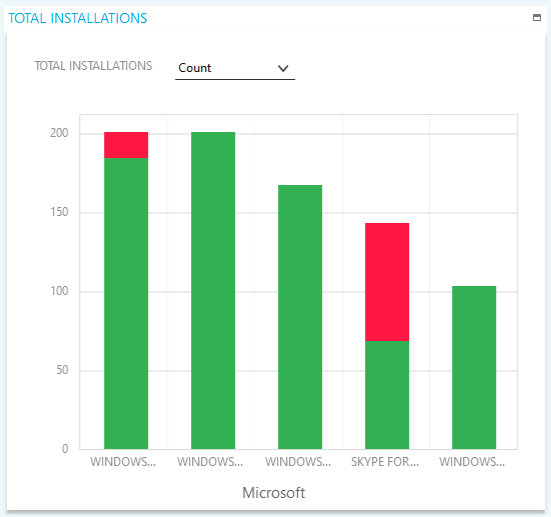
The Total Installations chart shows the most installed products for the selected Business Unit. You can use Dashboard Settings to change the number of displayed columns. You can drill into the data to show installations by manufacturer, product or product version. You can also launch Software Inventory Complete and By device reports for each column in the table. Please refer to the Reports topic for more information about Software Inventory reports.
Each column displays the total number of product installations for its item. The columns are ordered by the total number of product installations.
The columns are split into two stacks. The green stack shows the total number of licensed installations. The red stack shows the total number of non-licensed installations.
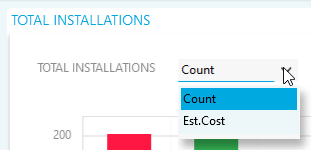
Total Installations can be represented as a number count or an estimated cost. Click the drop-down box above the chart to change the display.
Right click on any bar in the chart for drill and report options:
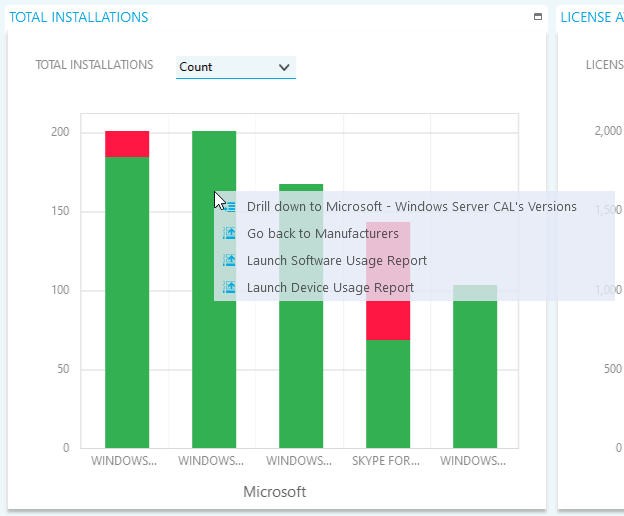
- Click Drill down to... to launch the total installations chart for the specified column.
- Click Go back to... to go back up to the total installations chart from the previous drill down.
- Click Launch... to launch the associated report.